 Monreal IT
 6 min read
Keep AI Useful After the Pilot Ends
 Bill Monreal : October 8, 2026
Keep deployed AI focused on business results with ongoing performance reviews, security checks, human oversight, and a clear plan for changes.

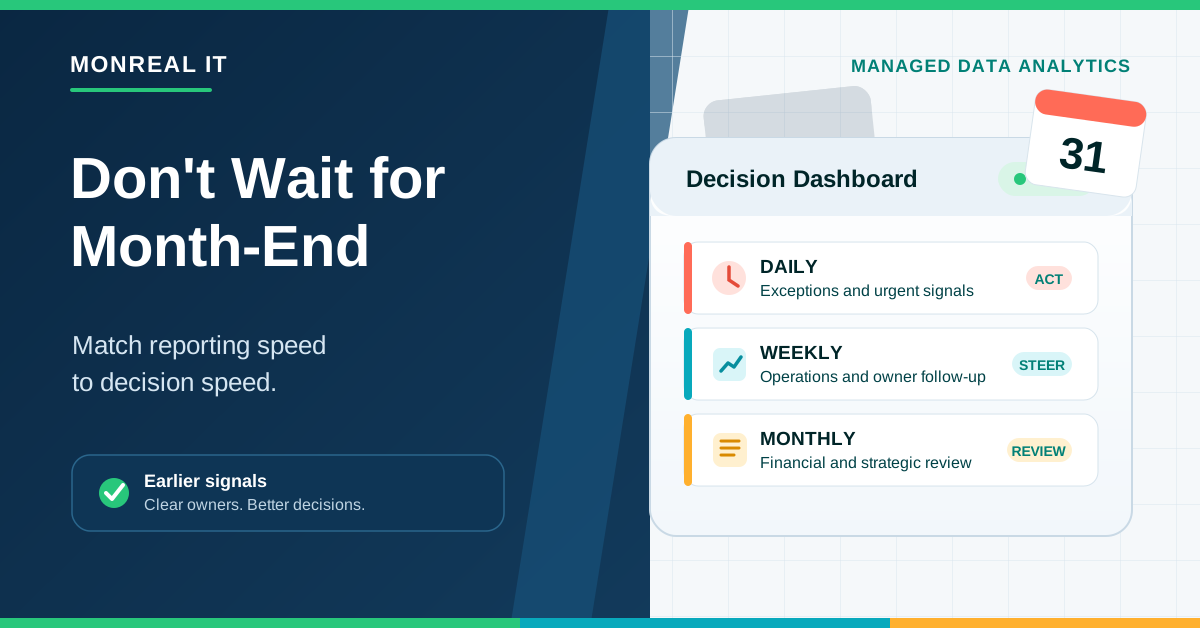
Monthly reports can be perfectly accurate and still arrive too late to help.
Picture a Monday leadership meeting. The revenue report covers last month, the labor report was exported three days ago, and someone is still reconciling two spreadsheets that disagree. By the time the team spots a margin problem, a scheduling bottleneck, or a jump in overdue invoices, the business has already spent several weeks living with it.
That doesn't make monthly reporting useless. Month-end reporting is still important for financial review, trend analysis, and accountability. The problem starts when a business uses a monthly cadence for decisions that need to happen weekly or daily.
A report only creates value while there's still time to act on it. A manufacturer can't recover last month's excess overtime after the payroll is processed. A medical practice can't refill appointment slots that went unused three weeks ago. A professional services firm can't easily correct low project utilization once the month is nearly over.
The right question isn't, "How frequently can we refresh everything?" It's, "How quickly does this number become too old to guide a decision?"
If inventory shortages need action within 24 hours, a monthly inventory report is mostly history. If cash flow planning changes slowly, a weekly view may be enough. If leadership is reviewing long-term profitability, the monthly close may be exactly right.
Real-time dashboards sound impressive, but most small and midsize businesses don't need every metric moving every second. In our view, that often creates more noise than clarity. Leaders start watching harmless fluctuations instead of responding to meaningful exceptions.
A better approach is to match each metric to the speed of the decision:
This three-speed rhythm is usually more useful and less expensive than forcing every system into a real-time dashboard.
Before choosing Power BI, buying another application, or asking someone to automate a workbook, pick one delayed decision that is costing the business time or money.
Ask three questions:
For example, a service company may want to spot projects that are consuming labor faster than expected. It doesn't need 40 charts to start. It may only need budgeted hours, actual hours, project stage, and an agreed threshold that triggers a review.
Clear ownership matters as much as the chart. A red number with no assigned response is just an attractive warning light.
Faster reporting won't help if sales, finance, and operations define the same metric differently. "Active customer," "gross margin," and "on-time delivery" sound obvious until three departments calculate them three different ways.
Write down the definition, source system, owner, update schedule, and acceptable delay for each priority metric. Then test the result against a few known transactions. This is where many dashboard projects discover that software sprawl is part of the reporting problem. Customer details live in one platform, job status in another, and the final adjustment exists only in someone's private spreadsheet.
Moving data from one system into another can reduce manual entry, but an integration shouldn't hide bad definitions. Microsoft's guidance on centralizing reusable data preparation logic makes the same practical point: shared transformation rules can support a more consistent source of truth across reports.
Once definitions are stable, look for the repetitive steps that delay the report. Common candidates include exporting CSV files, copying worksheet tabs, reformatting dates, matching customer names, and emailing attachments to the next person in line.
Tools such as Power Query, Power BI, application programming interfaces, and scheduled workflows can remove much of that handling. Microsoft's guidance on Power BI data refresh explains the difference between imported data, direct queries, scheduled refreshes, and visual refreshes. The details matter because a dashboard that looks current can still be displaying data from its last successful refresh.
Automation also needs an owner. Turn on failure notifications, document credentials and gateways, and name a backup person who can respond when a source changes. Fresh data is helpful. Silently broken automation is worse than the spreadsheet everyone already knows to double-check.
You don't need to rebuild the company's entire data environment at once. Start with one report and one operating decision.
During week one, choose the decision, measures, thresholds, and owners. During week two, map where the data originates and reconcile the definitions with finance and operations. During week three, build a small automated or semi-automated pilot. During week four, run it beside the existing report, compare the results, and document how the team should respond.
The parallel run is important. It gives people time to trust the new numbers and exposes missing adjustments before leadership treats the dashboard as authoritative. Expect a few differences. The goal isn't to pretend the data was always tidy. It's to understand and resolve the gaps.
If one of your priorities is catching cloud cost surprises, for example, begin with weekly spend, budget variance, and the owner responsible for investigating unusual changes. Don't start by building a giant technology scorecard.
Operational reports may contain customer information, employee performance data, financial details, or healthcare-related records. Give people only the access they need, review sharing permissions, and keep a record of who changes definitions or refresh logic.
It's also important to protect the systems behind your reporting. A polished dashboard isn't trustworthy if its source accounts are shared, former employees still have access, or critical data isn't backed up. Reporting governance and cybersecurity belong in the same conversation.
A simple weekly report may be manageable with the tools and people you already have. Outside help becomes useful when several systems need to be connected, nobody owns the data model, refresh failures keep returning, or access and security requirements are getting complicated.
That effort may involve your finance lead, operations manager, application vendors, and a managed IT services company Cleveland businesses already trust. A good partner should help you simplify the decision, document the data flow, and build an appropriate managed services plan. It shouldn't begin by selling the biggest dashboard it can fit on a screen.
Monthly reporting still has a job. It just shouldn't be asked to catch every problem. When you align reporting speed with decision speed, leaders get enough time to act, teams spend less time assembling spreadsheets, and the monthly meeting becomes a review of progress instead of an autopsy.

6 min read
Bill Monreal : October 8, 2026Keep deployed AI focused on business results with ongoing performance reviews, security checks, human oversight, and a clear plan for changes.
6 min read
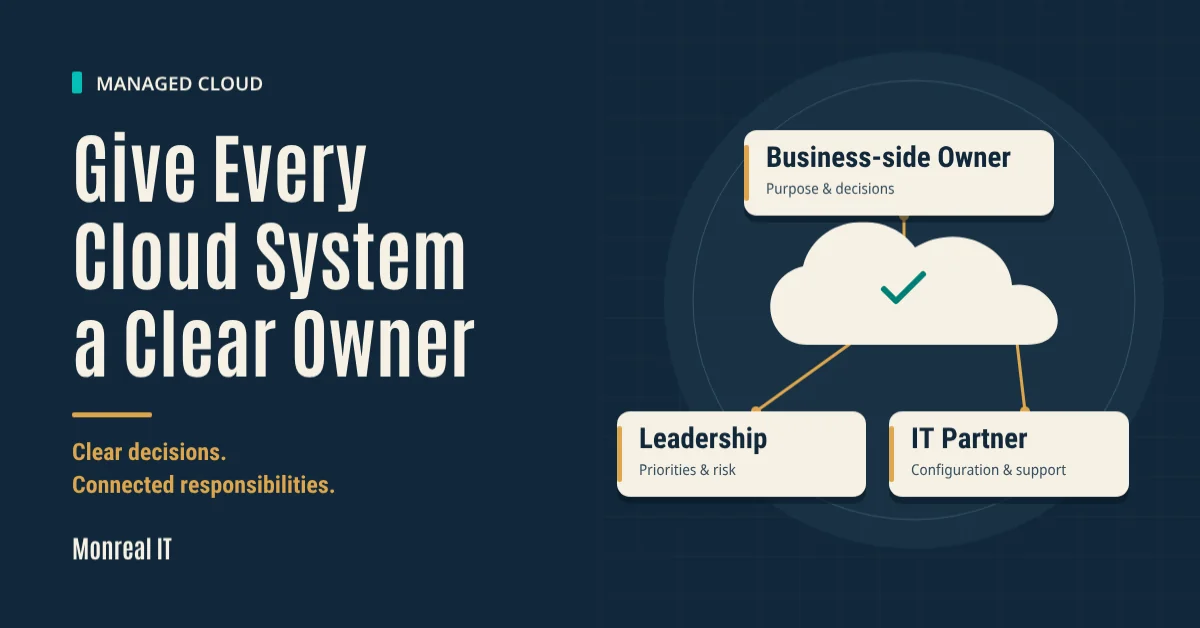
Bill Monreal : October 1, 2026Clarify who owns your cloud systems, approves changes, and reviews performance so business decisions don't fall between your team and IT.

6 min read
Bill Monreal : September 24, 2026Give internal AI better source material. Start with approved documents, clear owners, current information, and access that matches people's work.